As this is written, it is three days before the 2024 US presidential election. As was true in the previous election, this season has been full of heated rhetoric, with both candidates and their surrogates making sensationalistic claims about their opponents’ flaws, both personal and political. By the time you read this, the election will have happened and a victor will have been declared. If your candidate won, you are likely sanguine about the future, including your investments and your financial strategy. On the other hand, if the “wrong” candidate won, you may be fearful that all is lost and that the markets are about to take a dive, pulling the value of your portfolio down with them.
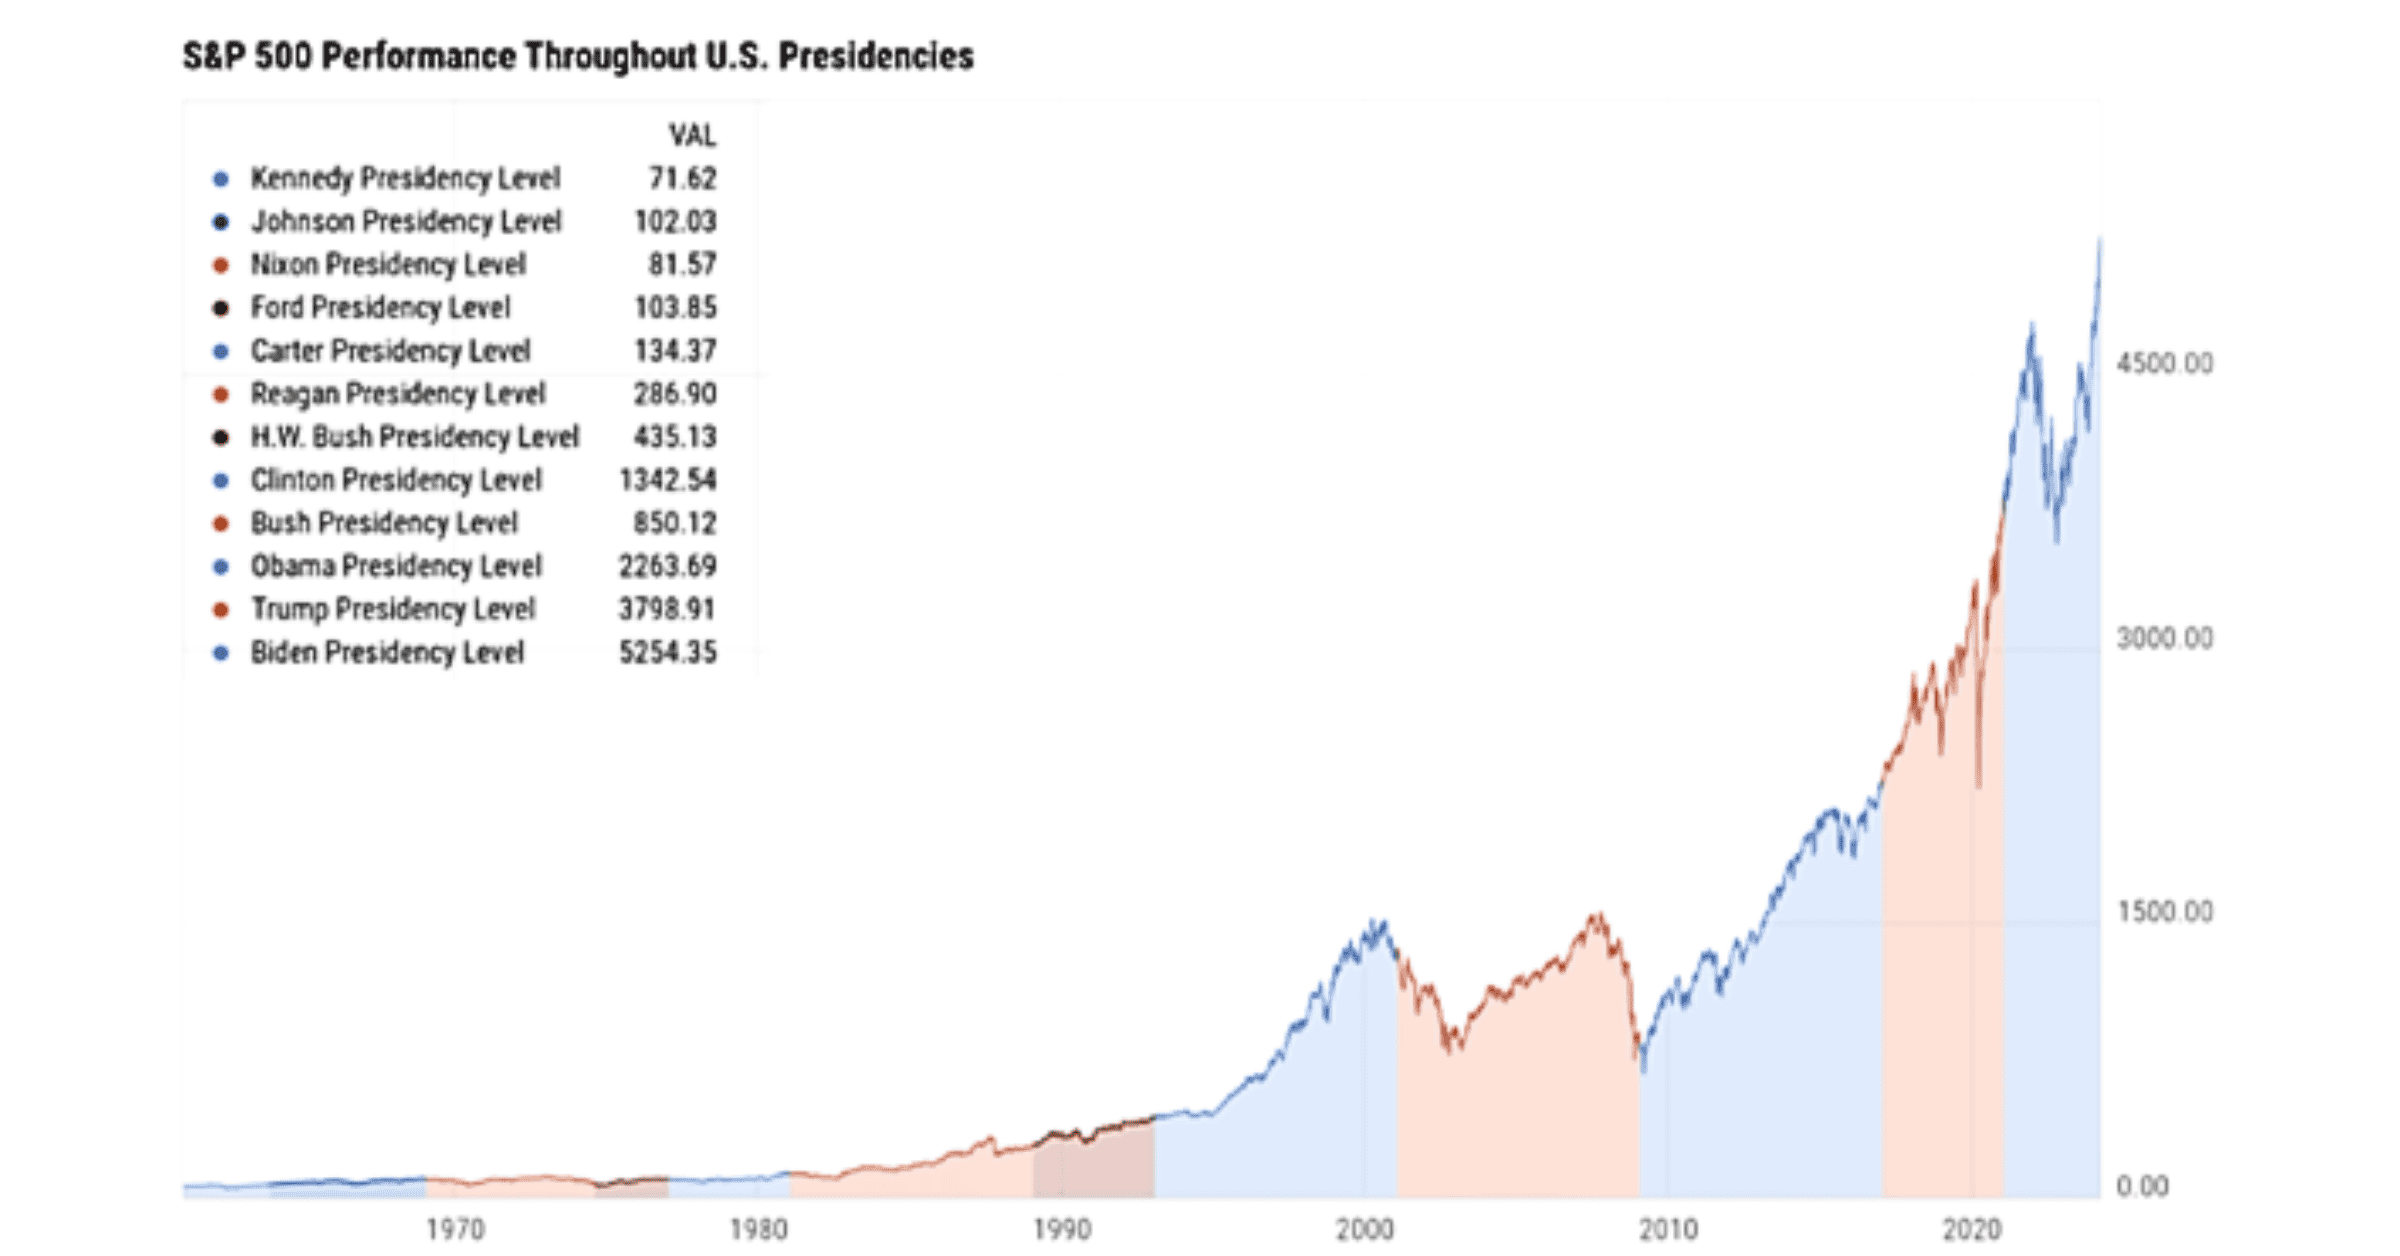
But take heart. The financial markets have historically proven not only their resilience under a variety of dramatic circumstances, but also their relative indifference to the party to which the occupant of the White House belongs. In other words, the financial markets are not affiliated with either the GOP or the Democratic Party. In fact, over the past ninety years, the stock markets have trended steadily upward—with intermittent drops in pricing, to be sure—during both Republican and Democrat administrations. Take a look at the following chart, which illustrates the trend of the markets under various administrations, going back to JFK, in the early 1960s:
SOURCE: Y Charts. S&P 500, 1/20/1961–3/28/2024. Past performance is no guarantee of future results; indices are not available for direct investment.
As you can readily see, the S&P 500 has had its ups and downs, under both Republican and Democrat presidents. And yet, the clear overall trend is upward. In fact, the longest bull market in history (so far) began under President Obama and continued under President Trump, until it was interrupted by the COVID-19 pandemic. The upward trajectory then resumed and continued higher under President Biden until about 2022, when spiking inflation depressed equity prices. Then, in 2023, the upward march continued. History suggests, then, that it is difficult to document a significant statistical correlation between the party of the US president and stock market performance during their administration.
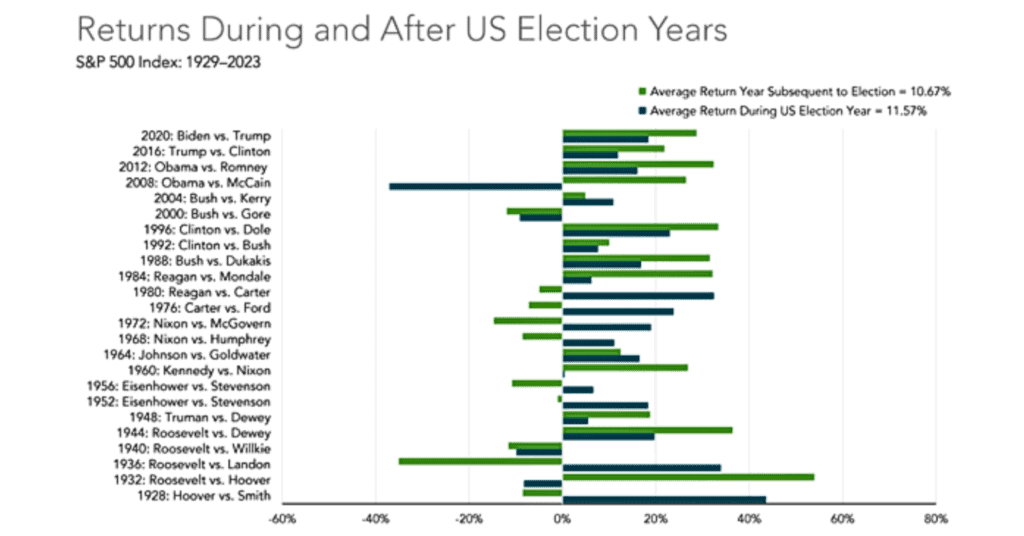
“But,” you may say, “that’s a general trend. What about during and after election years?” This is a valid concern, but once again, history offers little in the way of specific correlation between the party of the winning candidate and stock market performance. Take a look at the following chart.
SOURCE: S&P 500 data © 2024 S&P Down Jones Indices LLC. Past performance is not a guarantee of future results; indices are not available for direct investment.
Once again, the general trend during and in the year immediately following the election is for gains, with the average return during the election year (the darker bars) coming in at 11.57% (though some years have seen negative returns), and the average for the year following the election registering a gain of 10.67% (again, with some years showing negative returns).
Now, as we know, past performance of the financial markets is no guarantee of future outcomes. However, historical data suggest that, so far at least, there is no clear correlation between the party of the winning candidate and any specific result for the equity markets.
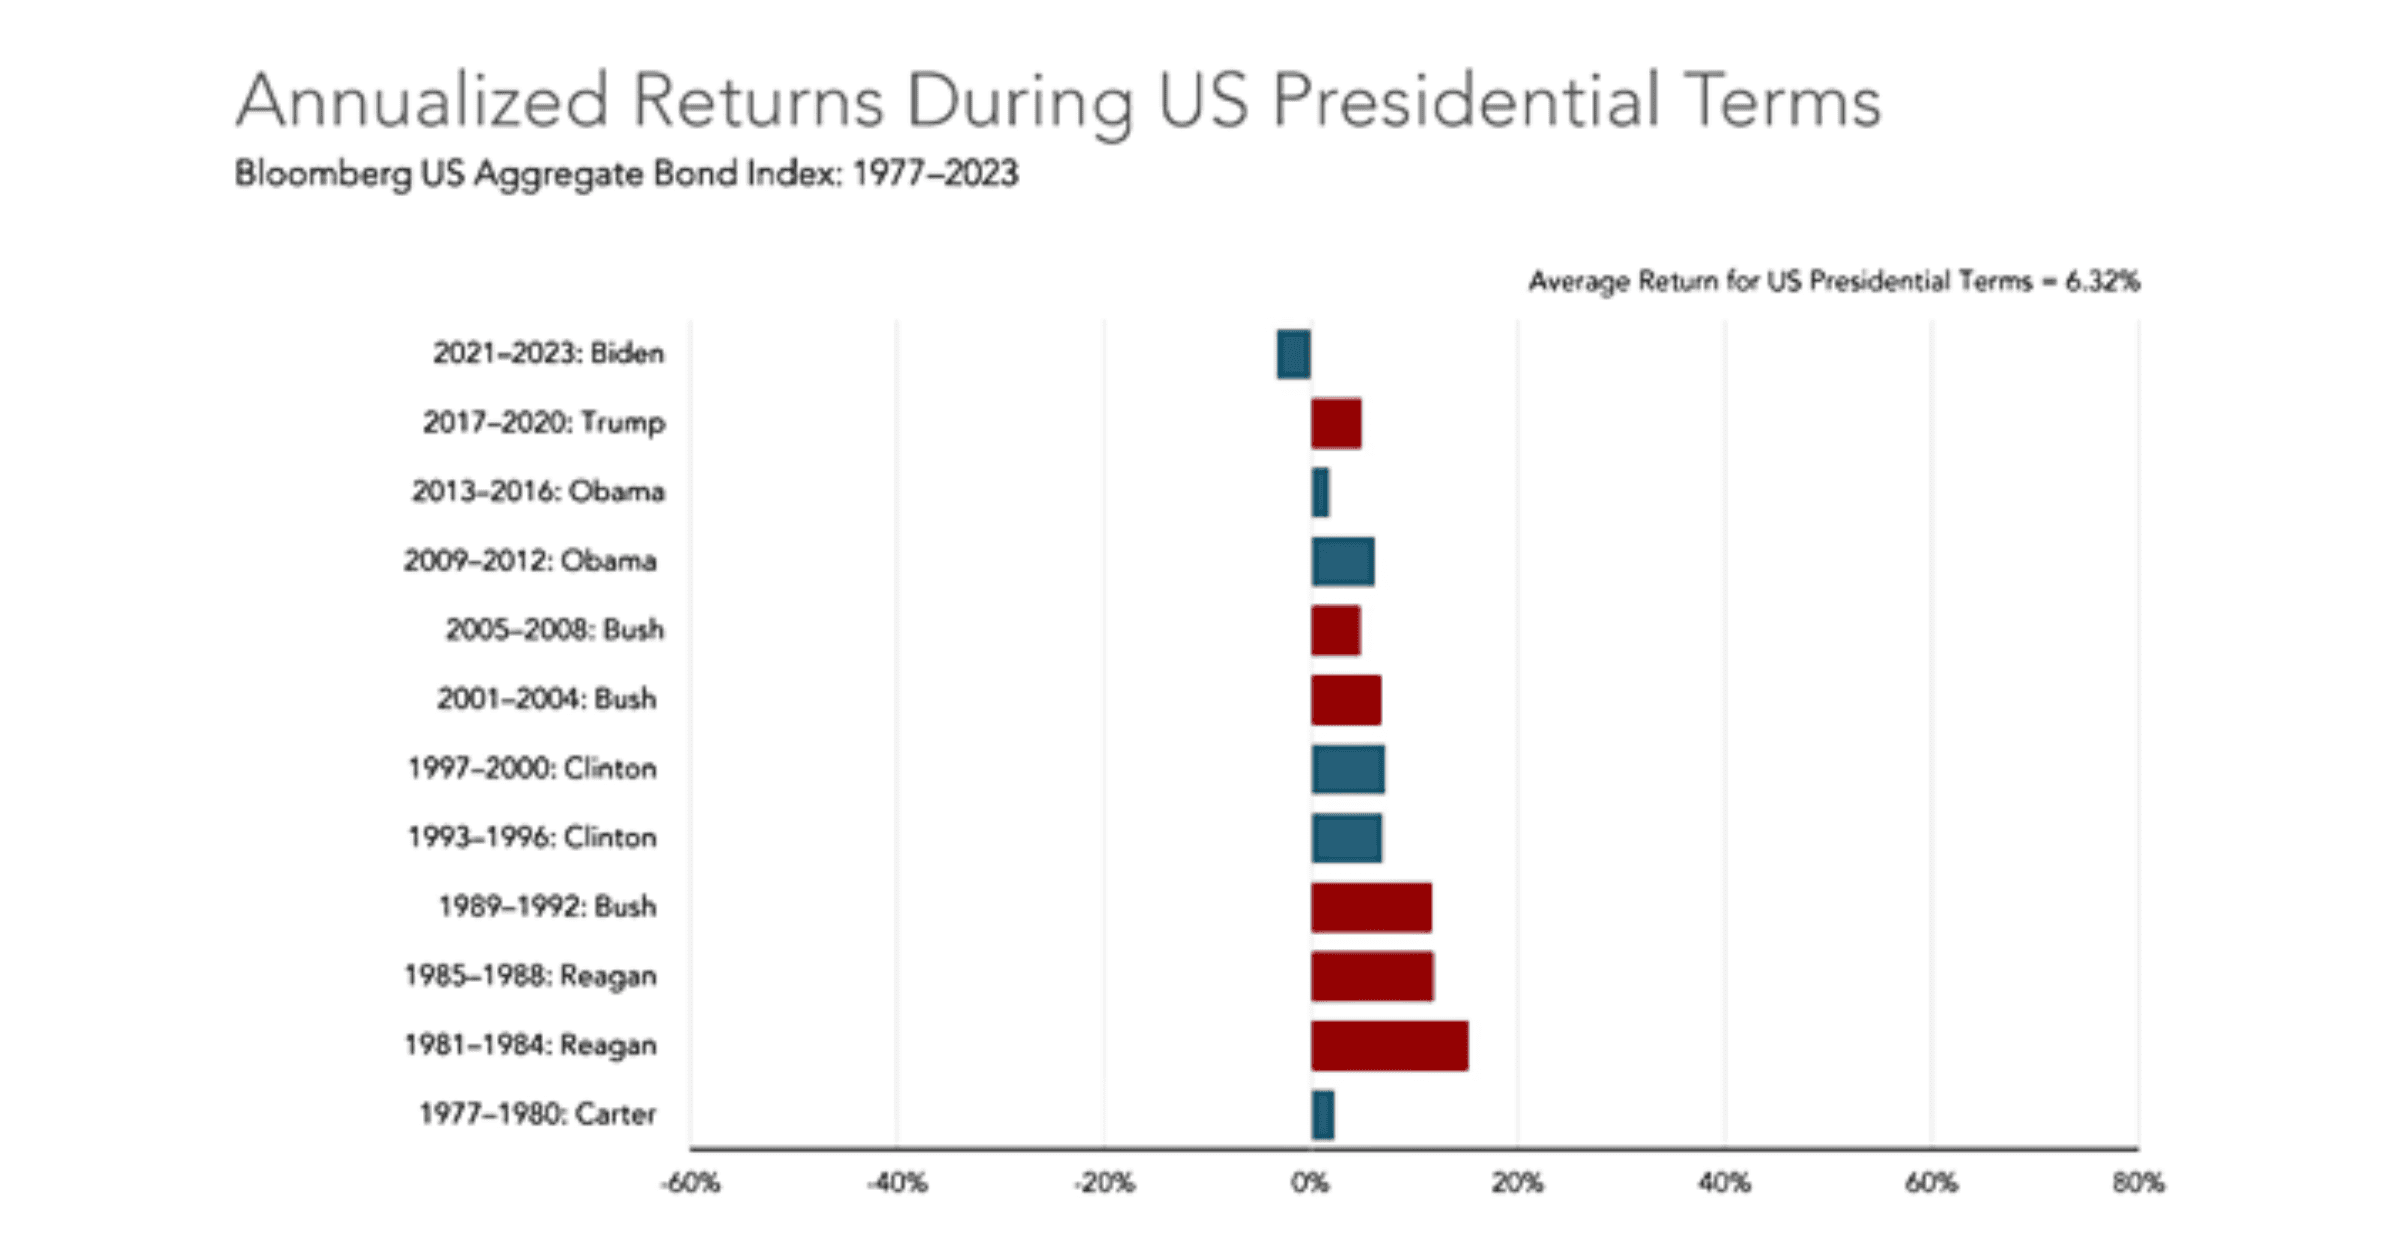
But what about the fixed income markets? Let’s take a look at the annualized returns of the fixed income markets during every administration from Jimmy Carter to Joe Biden:
SOURCE: Bloomberg
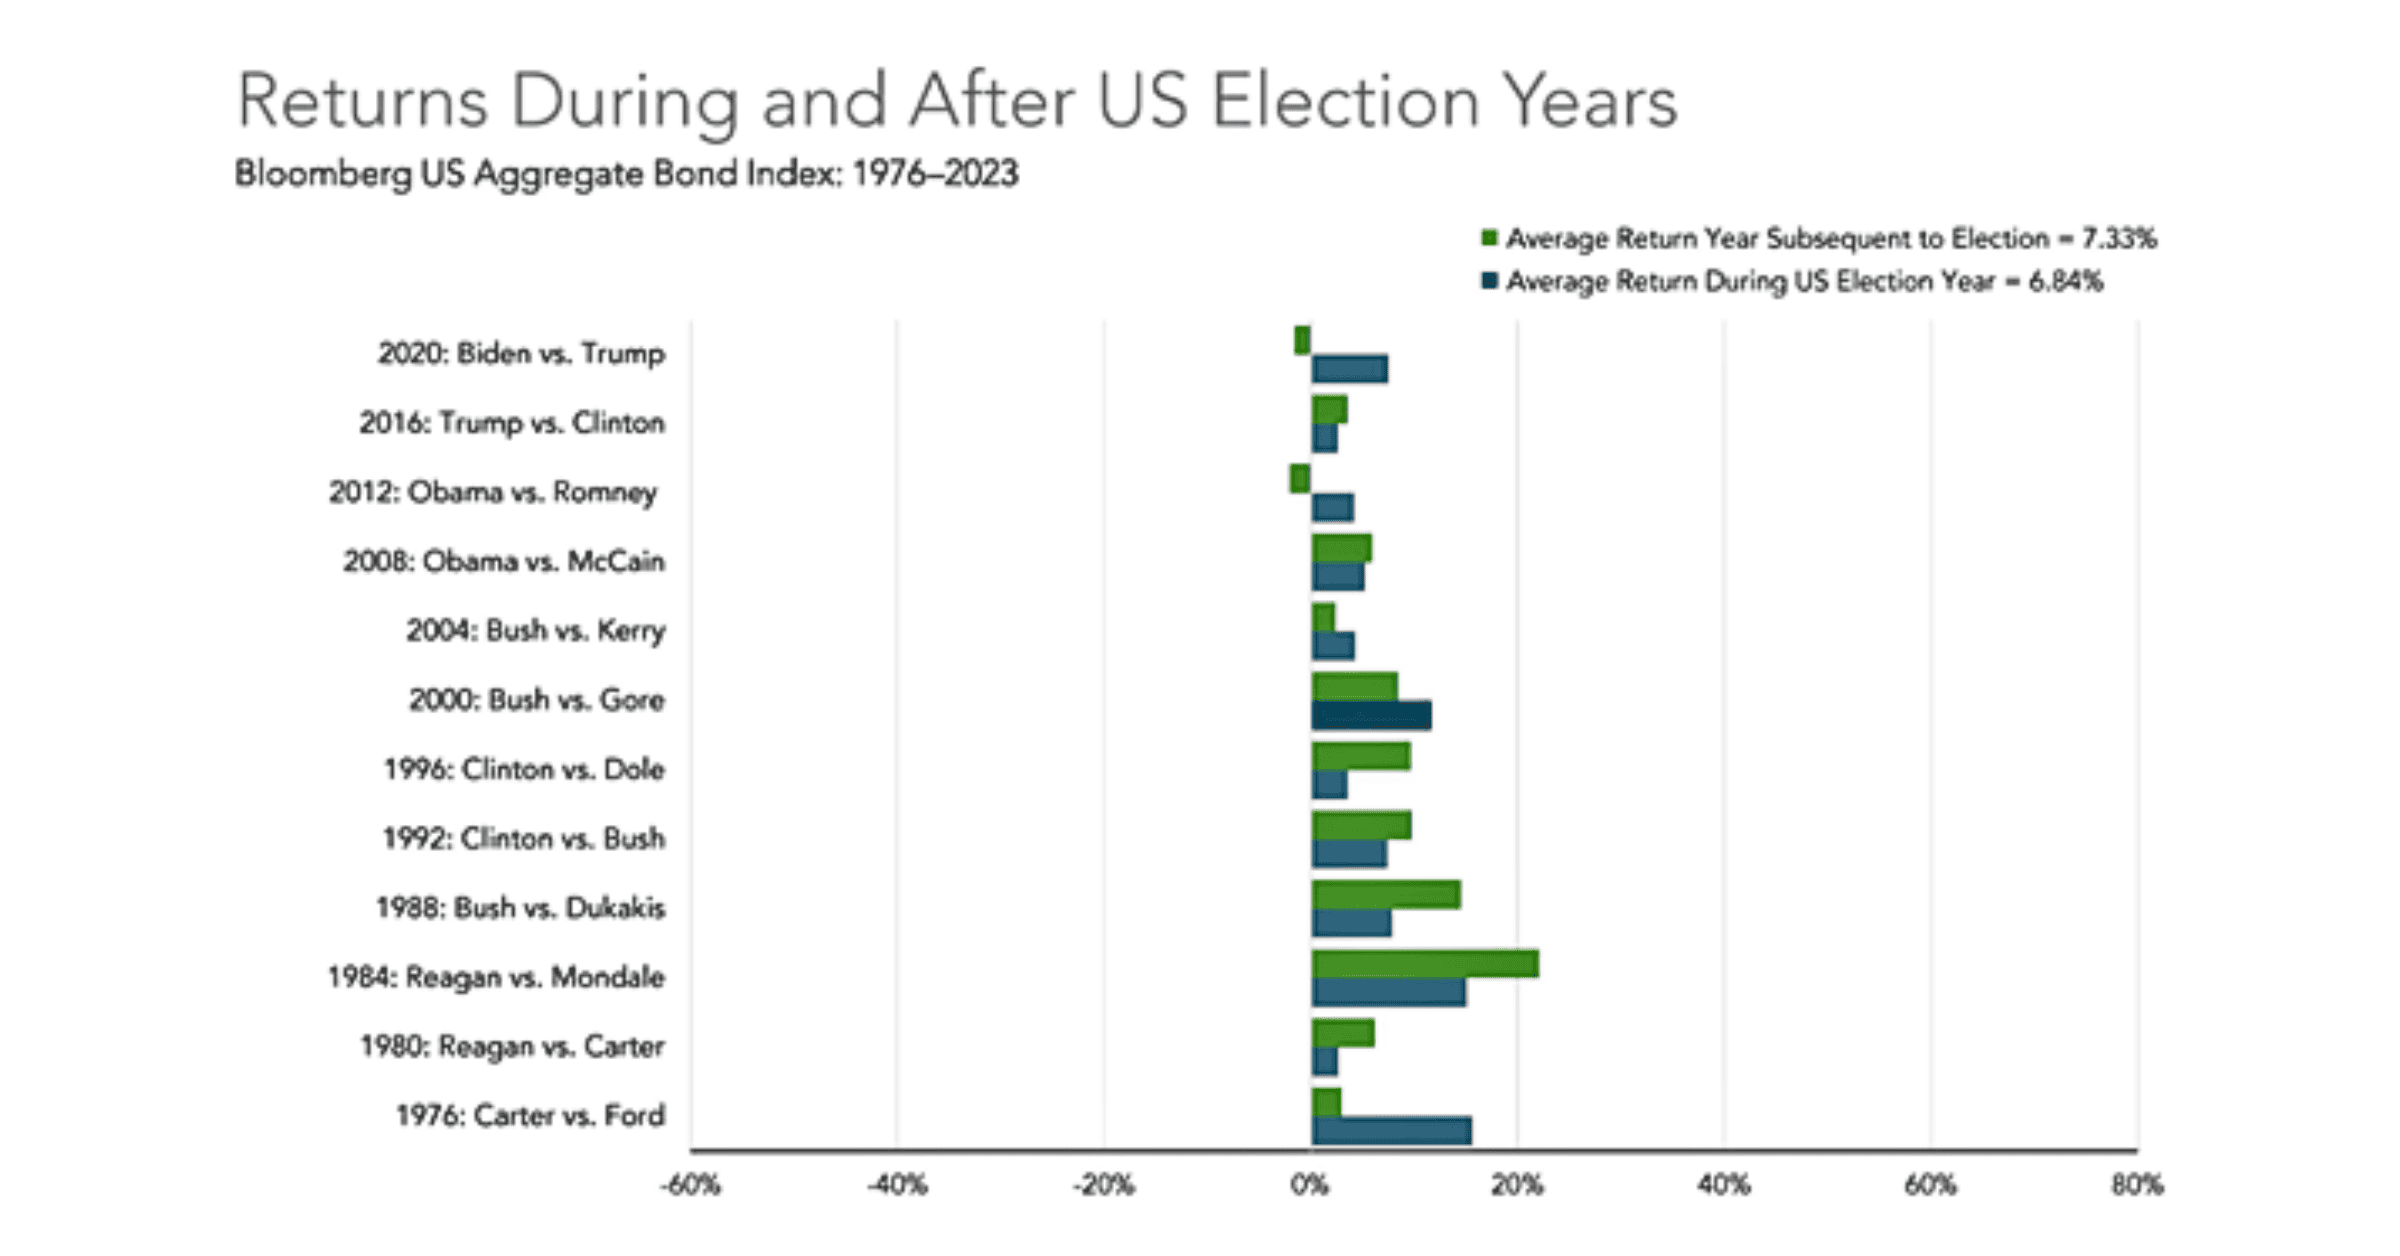
Once again, we see a fairly even distribution of returns during the administrations of both parties, with perhaps a slight nod toward the GOP. The average aggregate annualized return for bonds since 1977 has been 6.32%. In the year of the election and the one immediately following, the record looks like this:
SOURCE: Bloomberg
The average return during election years, starting in 1976 (the darker bars), has been 6.84%, and in the year following the election, the average has been 7.33%. Most years have seen positive returns.
It may also help to keep in mind that the president, whoever he or she is, does not singlehandedly control the economy, taxation, or other important matters that can have a direct effect on your portfolio. The fact is, equity markets are supremely complicated and affected by a myriad of factors, with the occupant of the White House being only a single data point—and one that is not strongly correlated historically with stock market performance. Wars and international tensions, inflation and other economic matters, actions by Congress, natural disasters, and dozens of other things can exert upward or downward pressure on market pricing.
Are you curious about which presidents’ terms have been marked by the highest market returns? For the period going back to JFK, the record-holder is Bill Clinton (D-1993–2001), who saw a +209.8% rise in the S&P 500 during his presidency. The runner-up is Barack Obama (D-2009–17), with a 181.1% return. Next is Dwight Eisenhower (R-1953–61), at 129%. Only three presidents since 1929 have seen negative stock market returns during their terms: Herbert Hoover (R-1929–33, -77.1%), Richard Nixon (R-1969–74, -19.8%), and George W. Bush (2001–09, -36.7%).
Naturally, it is just as impossible to predict how the markets will do if this or that candidate is elected as it is any other time. There are simply too many unknown variables that can cause market pricing to move in either direction, and none of us have a crystal ball (at least, one that works reliably). Of course, we are all faced daily by an onslaught of news headlines suggesting this or that outcome that “could” occur if a particular candidate wins and is successful in enacting some piece of legislation. But speculating on the financial markets’ responses to any particular event is generally not the most advantageous method for reaching your important long-term financial goals.
So, maybe the best approach for most investors—not only in an election year but all the time—is to remember to focus on what you can control. Once you’ve exercised your right to vote for the candidate of your choice, you have no further control over the outcome of this or any other election. You have only limited control over the policies or laws that will be supported or enacted by your public officials. You have no control whatsoever over the daily price movements of the financial markets.
But you do have control over several very important factors. You can control the amount of diversification in your portfolio, which is the best protection against market volatility. You can control the rebalancing among asset classes in your portfolio, to ensure that your investments remain in the correct proportions that match your risk tolerance and goals. And you can control your commitment to a long-term financial and investment strategy that is geared to your specific goals and stage in life. You can also control your reaction to news headlines, the claims and counterclaims of competing politicians, and predictions that may or may not come to pass.
History and financial research tell us that investors who remain patient, well diversified, and committed to a long-term strategy will do well over time, in most circumstances. Those same characteristics hold true during election years. And if you have questions or concerns about your portfolio, the economy, or any other important financial matter, please get in touch with us.


